




- The national average asking price of $830,022 was just 0.6% above the average selling price of $824,698.
- Coromandel saw the biggest gap, with the region’s average selling price sitting 4.5%, or $45,900, below average asking prices.
- Central Otago/Lakes District recorded an average selling price that was 2.1%, or $30,000, higher than the region’s average asking price.
New data reveals that while Kiwis sold their homes for an average of $5,324 (0.6%) below the national average asking price over the last 12 months, the gap varies considerably depending on where you're buying.
An analysis of the New Zealand property market found that over the past year, average selling prices* sat below average asking prices in 12 out of 19 regions, while seven regions bucked the trend by recording average selling prices above their average asking prices.
Coromandel recorded the largest gap, with an average selling price of $969,696, which was 4.5%, or approximately $45,900, below the region’s average asking price of $1,015,592. Meanwhile, at the other end of the country, Central Otago/Lakes District recorded an average selling price that was $30,000 (2.1%) higher than the region’s average asking price (asking price of $1,411,460 versus a selling price of $1,441,503).
Vanessa Williams, General Manager of Customer at realestate.co.nz, says the figures offer valuable insight for Kiwis wondering how much to offer on their next home.
"For many buyers, deciding what to offer can feel like a guessing game. You don't want to pay more than you need to, but you don't want to miss out on a property you love, either. This data gives buyers another piece of the puzzle, showing how asking and selling prices have compared in their region over the past year."
Williams says one of the most interesting findings is just how closely asking and selling prices continue to track.
"Even in the region with the biggest gap, there was less than a 5% difference between average asking prices and average selling prices. That's a surprisingly small difference and a useful reminder that asking prices remain a credible starting point for negotiations."
Where are the biggest gaps between asking and selling prices?#
Coromandel wasn't the only North Island region where average selling prices fell short of asking prices. The gap between average asking and selling prices varied across the regions:
- Wairarapa: 3.4% below asking price.
- Central North Island: 2.8% below asking price.
- Auckland and Bay of Plenty: 2.1% below asking price.
- Northland: 2.0% below asking price.
- Gisborne: 1.8% below asking price.
- Waikato: 1.4% below asking price.
- Marlborough: 1.3% below asking price.
- Hawke's Bay: 0.5% below asking price.
- Manawatū/Whanganui: 0.4% below asking price.
- Nelson & Bays: 0.2% below asking price.
In Auckland, the 2.1% gap equated to approximately $24,000, with an average asking price of $1.129 million compared with an average selling price of $1.105 million.
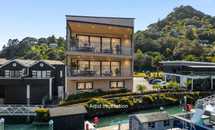
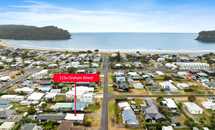
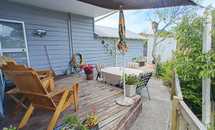
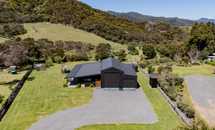
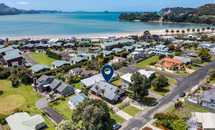
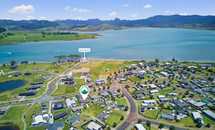
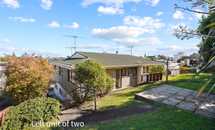
Coromandel, New Zealand
View more: Coromandel, New Zealand












Offering under asking? Not everywhere#
While average selling prices sat below asking in most regions, the reverse was true in several parts of the country.
- Central Otago/Lakes District: 2.1% above asking price (approximately $30,000). The region also recorded the country's highest average selling price at $1.442 million.
- Canterbury: 1.7% above asking price.
- Southland: 1.6% above asking price.
- West Coast: 1.0% above asking price. Despite this, it remained the country's most affordable region, with an average selling price of $482,000.
- Wellington: 0.9% above asking price.
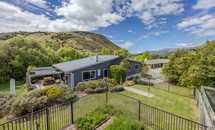
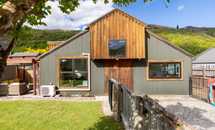
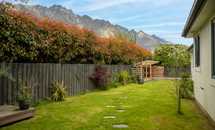
Central Otago / Lakes District, New Zealand
View more: Central Otago / Lakes District, New Zealand











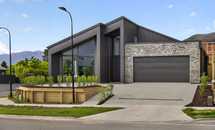
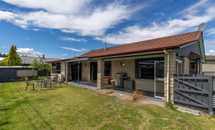
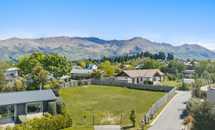



Williams says the results highlight why buyers shouldn't assume offering below asking is necessarily the norm in every region.
"While average selling prices are below asking in many parts of New Zealand, there are still regions where they're coming in higher.
"It's about doing your homework. Look at what comparable properties are selling for, understand your local market and get advice from a real estate professional."
*Source: REINZ, based on average asking price and sale price data for the last 12 months ending September 2026.

The analysis compares average asking prices for residential properties listed on realestate.co.nz with average selling prices reported by REINZ between October 2025 and September 2026. The figures represent regional and national averages, rather than the difference between asking and selling prices for individual properties.
For media enquiries, please contact:#
Hannah Franklin | hannah@realestate.co.nz
Want more property insights? #
- Market insights: Search by suburb to see median sale prices, popular property types and trends over time.
- Sold properties: Switch your search to sold to see the last 12 months of sales and prices.
Glossary of terms: #
Average asking price (AAP) is neither a valuation nor the sale price. It is an indication of current market sentiment. Statistically, asking prices tend to correlate closely with the sales prices recorded in future months when those properties are sold. As it looks at different data, average asking prices may differ from recorded sales data released simultaneously.
New listings are a record of all the new residential dwellings listed for sale on realestate.co.nz for the relevant calendar month. The site reflects 97% of all properties listed through licensed real estate agents and major developers in New Zealand. This description gives a representative view of the New Zealand property market.
Stock is the total number of residential dwellings that are for sale on realestate.co.nz on the penultimate day of the month.
Rate of sale is a measure of how long it would take, theoretically, to sell the current stock at current average rates of sale if no new properties were to be listed for sale. It provides a measure of the rate of turnover in the market.
Seasonal adjustment is a method realestate.co.nz uses to represent better the core underlying trend of the property market in New Zealand. This is done using methodology from the New Zealand Institute of Economic Research.
Truncated mean is the method realestate.co.nz uses to supply statistically relevant asking prices. The top and bottom 10% of listings in each area are removed before the average is calculated to prevent exceptional listings from providing false impressions.


