April: Back in motion – New Zealand property market returns to 2021 activity levels
The New Zealand Property Report
Key figures
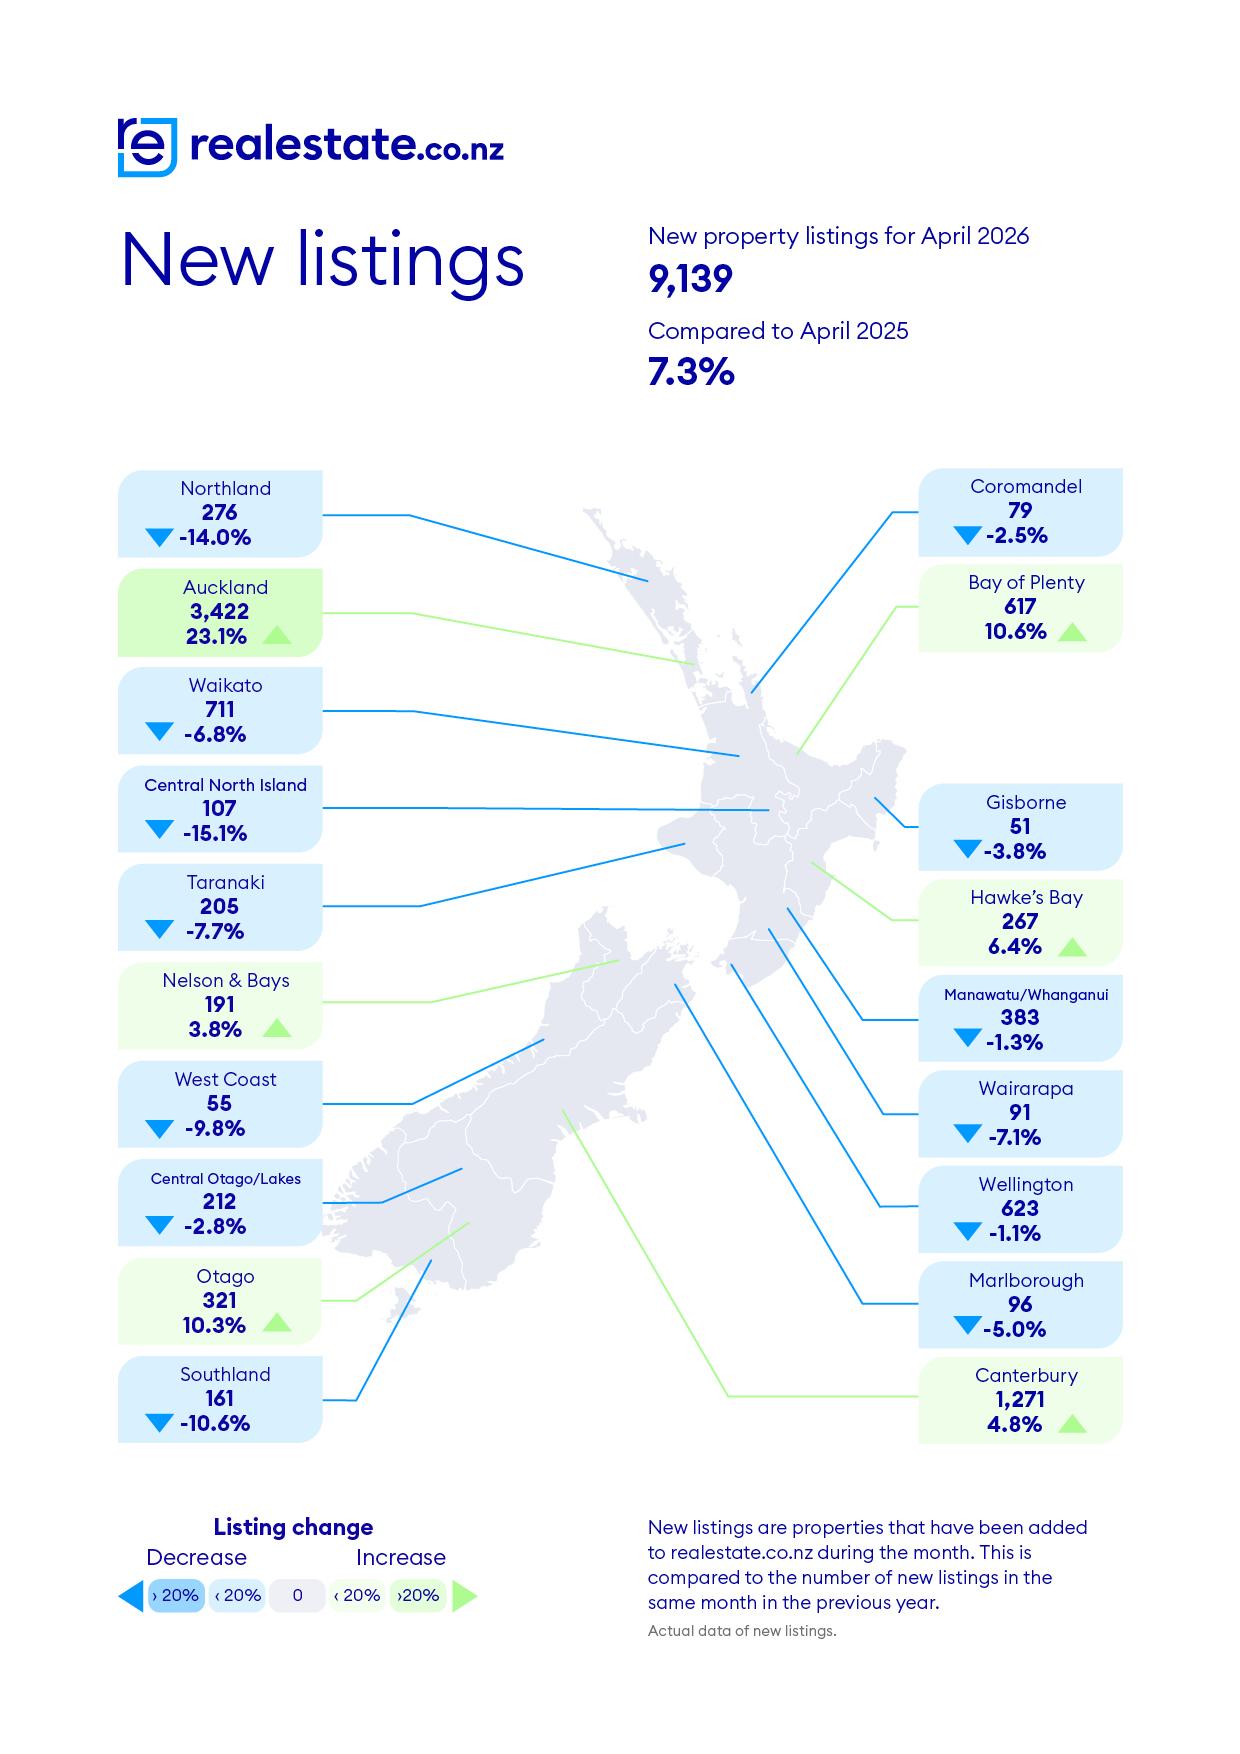
- New listings up 7.3% year-on-year to 9,139 in April 2026
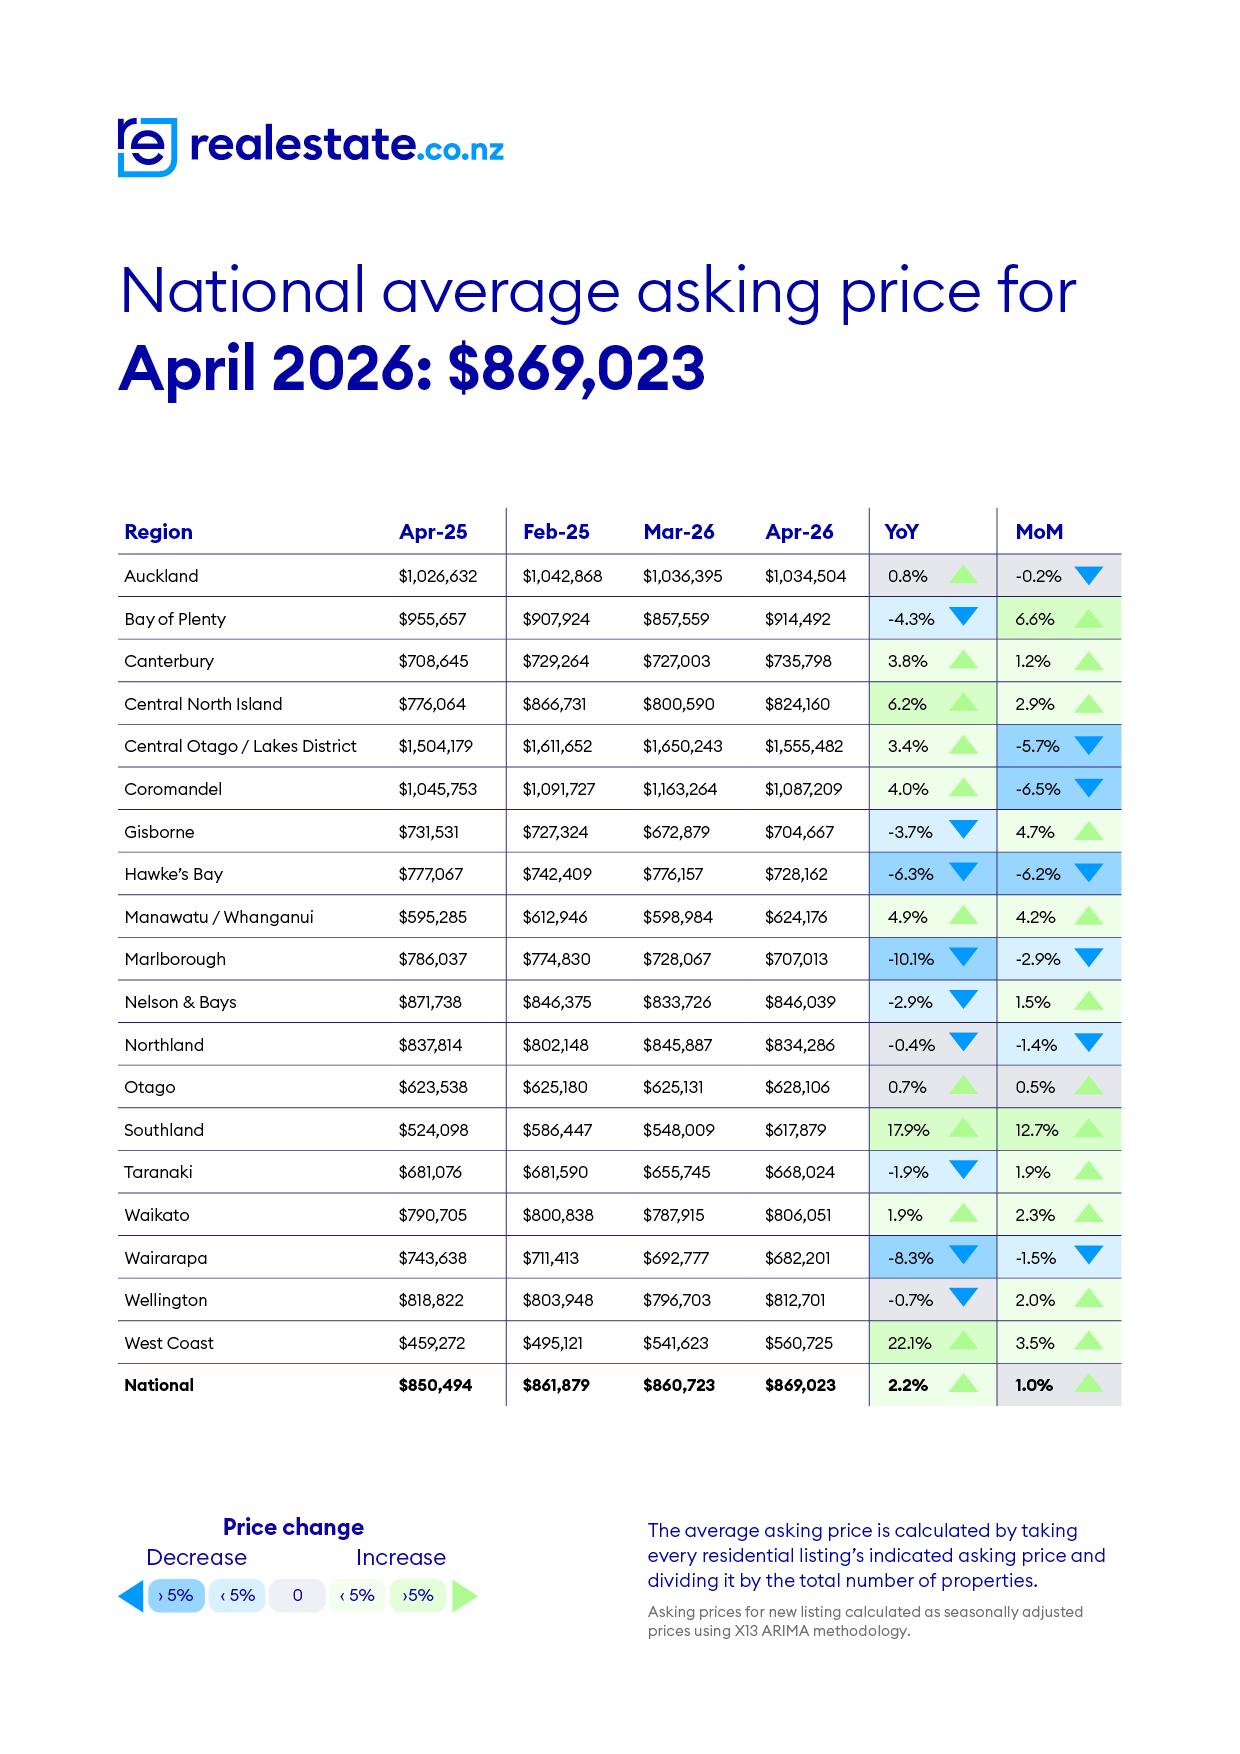
- National average asking price up 2.2% to $869,023
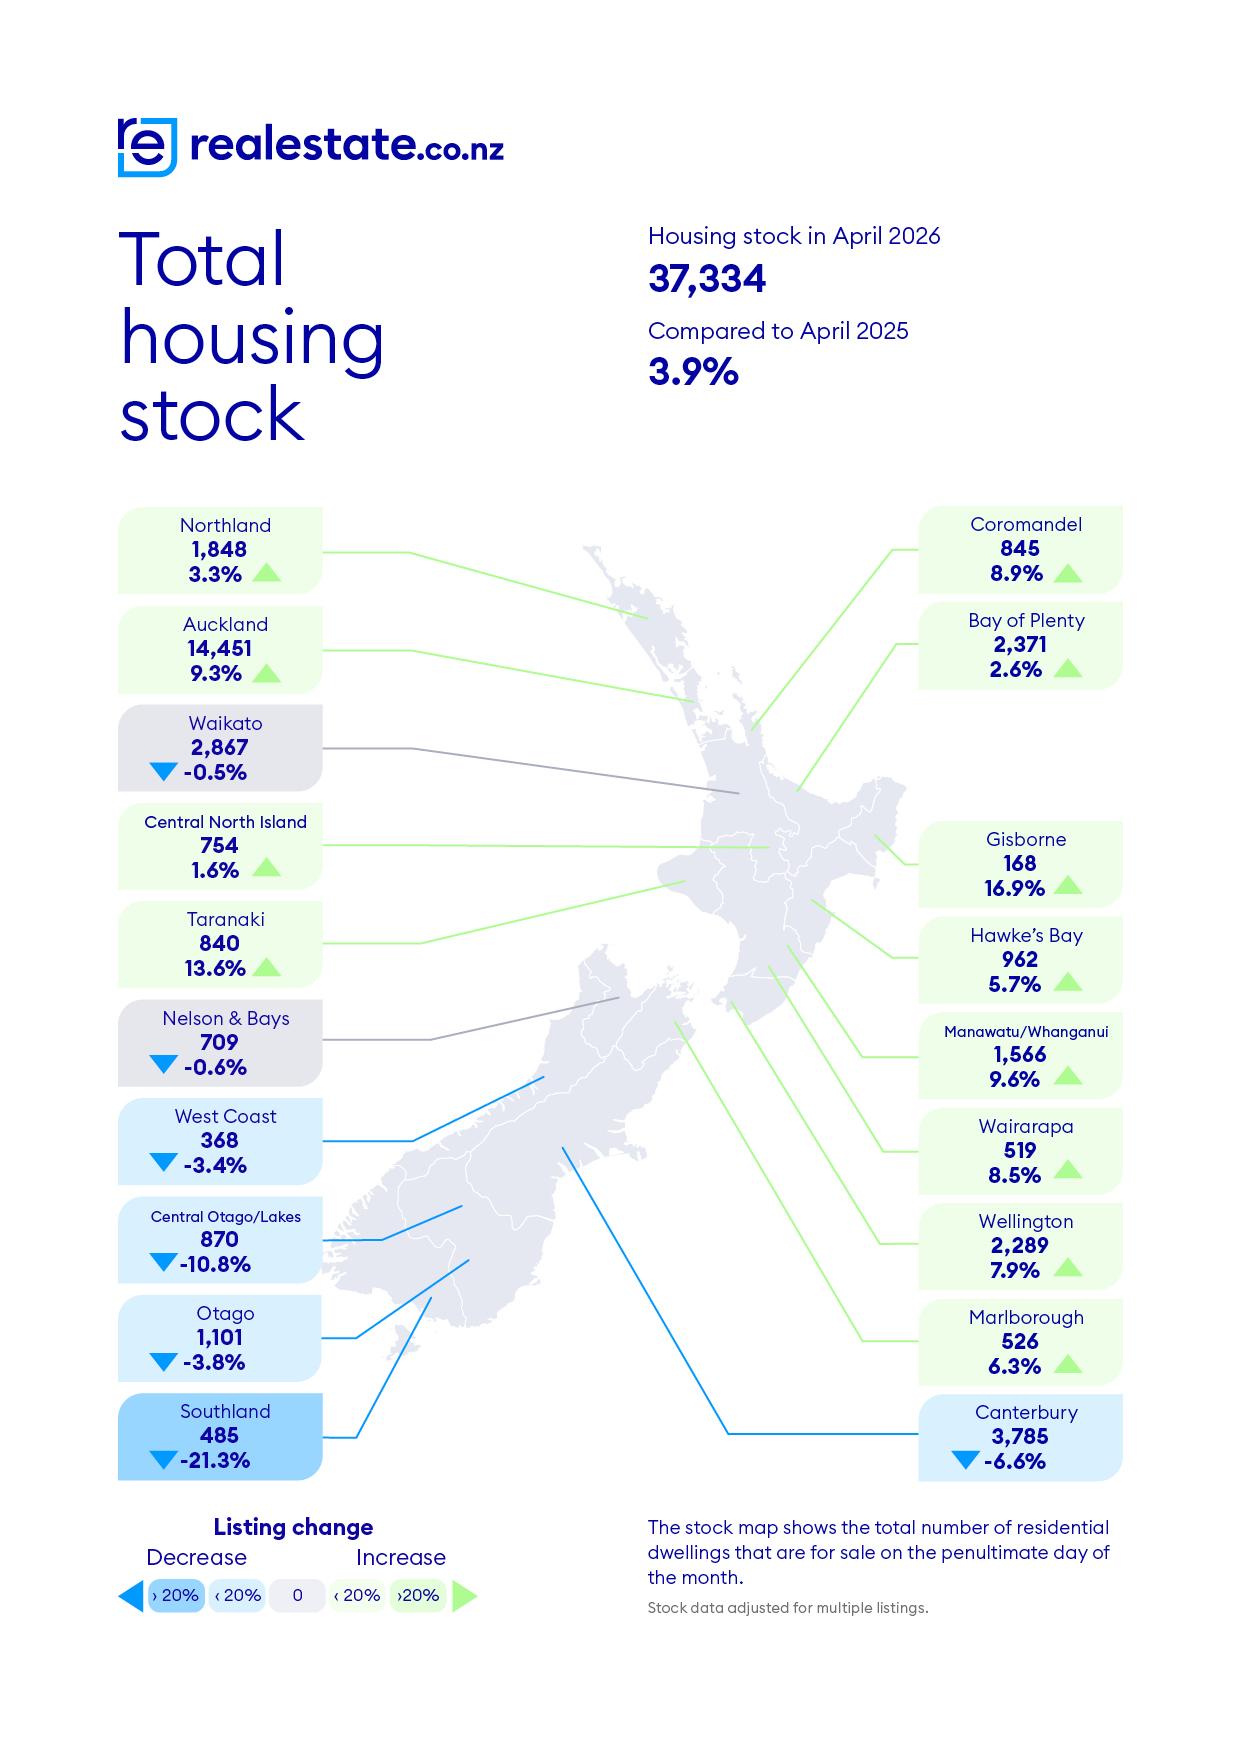
- Stock hits 37,334, a 3.9% increase year-on-year
- 7,853 properties sold in March, the highest total since November 2021
Latest data from realestate.co.nz reveals activity in the New Zealand property market has returned to 2021 levels, which is considered the most recent market peak.
Total new listings were up 7.3% year-on-year to 9,139 in April 2026, compared to 8,518 in April 2025, and average asking prices were up 2.2% year-on-year to $869,023.
Sarah Wood, CEO of realestate.co.nz says despite global uncertainty and economic pressures, there’s movement in the property market.
“We’re seeing more people browsing for property on our site, both locally and from overseas, and with total enquiries up by 14% year-on-year*, there’s clear intent from buyers.”
REINZ sales data showed 7,853 properties sold during March, the highest number of sales in a month since November 2021 (8,370).
Is it a balanced market for buyers and sellers?
The increase in activity comes at a time when prices remain stable. Despite seeing an increase in April, the national average asking price has hovered between $840,000 and $890,000 for more than three years showing levels of stability we have not seen in recent history.
In the southern regions, both Canterbury and Southland recorded all-time average asking price highs:
- Canterbury’s average asking price was $735,798, a 3.8% increase on April last year, and overtaking the region’s previous high of $735,383 back in March 2022.
- Southland recorded an average asking price high of $617,879, 17.9% year-on-year increase from April 2025 and the first time the region has tipped into the $600,000 bracket.
- The West Coast recorded a new April high, with a double-digit, year-on-year increase of 22.1%, with an average asking price of $560,725.
Marlborough was the only region to report a double-digit decline in April 2026, down 10.1% to $707,013, compared to $786,037 in April 2025.
What does regional activity mean for buyers and sellers?
Three regions experienced double-digit, year-on-year new listings growth in April:
Auckland’s new listings rose 23.1% in April 2026 to 3,422 compared to 2,779 in April last year.
Bay of Plenty’s new listings rose 10.6% to 617, compared to 558 in April 2025
Otago had 321 new listings, an increase of 10.3% on its 291 new listings in April last year.
At the other end of the scale, three regions experienced double-digit declines: Northland down 14.0%, Central North Island down 15.1%, and Southland down 10.6% year-on-year.
Wood says this is creating a rare window of opportunity for smart buyers and sellers.
“The market is finding its footing again and it’s come with a more measured dynamic between buyers and sellers. There isn’t the urgency of past peaks, this is more sustainable. Buyers have choice, sellers have confidence and the level of stability the property market is offering is enabling people to make considered decisions. Right now, the conditions are there for those ready to act.”
For media enquiries, please contact:
Hannah Franklin | hannah@realestate.co.nz
Want more property insights?
- Market Insights: Search by suburb to see median sale prices, popular property types and trends over time.
- Switch your search to Sold to browse all residential properties that have sold — not just recent sales. See the most recent sale price and estimated current market value.