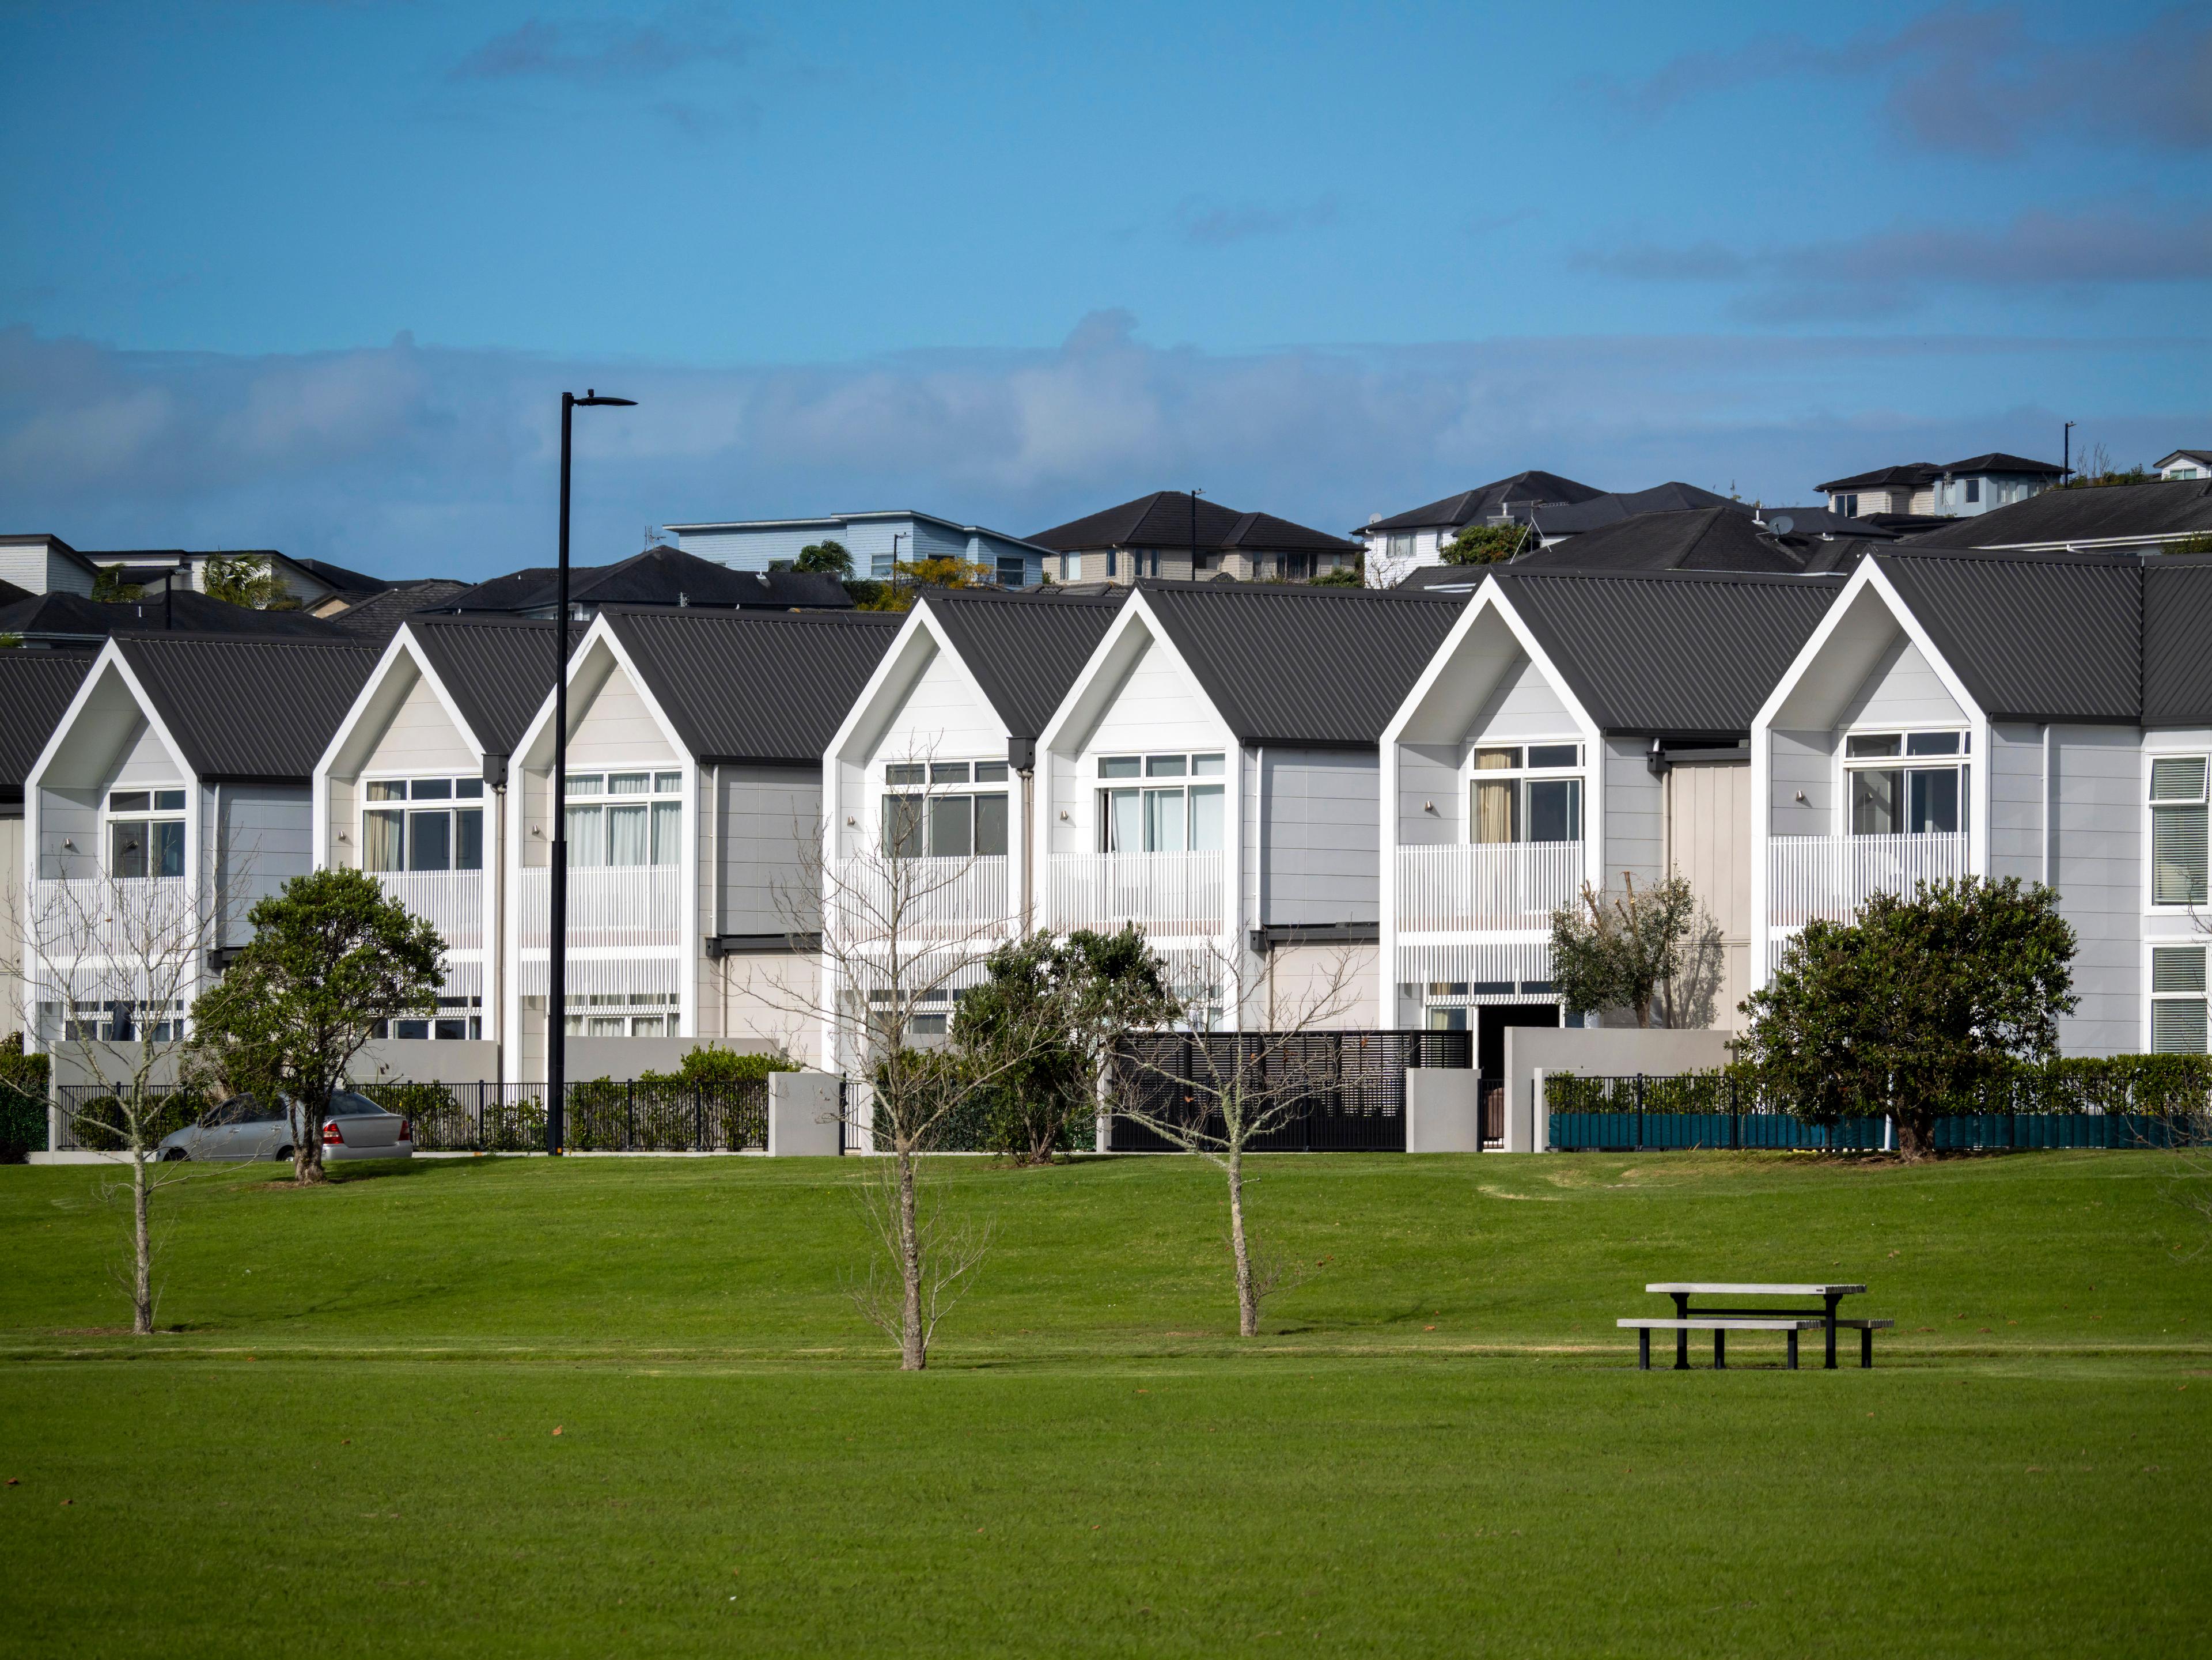
The New Zealand Rental Report uses the latest realestate.co.nz data to provide a monthly snapshot of what’s happening across the rental market, from how many rental homes are listed during the month to how average weekly rent prices are changing.
Whether you're a renter, landlord, property investor, or simply keeping an eye on the market, we've broken down some of the key terms you'll come across in our reports.
Average weekly rental price#
The average weekly rental price is the average amount landlords and property managers are asking tenants to pay per week for rental properties listed on realestate.co.nz during a particular month.
It's an indicator of current rental market conditions, rather than the amount tenants are necessarily paying.
How is it calculated?
At realestate.co.nz, we use a method called a truncated mean to calculate average weekly rental prices.
This involves removing the highest 10% and lowest 10% of rental asking prices in each area before calculating the average of the remaining properties.
By excluding these extremes, we can provide a more representative picture of rental asking prices without unusually expensive or inexpensive properties significantly influencing the results.
New rental listings#
New rental listings refer to the number of residential dwellings newly advertised for rent on realestate.co.nz during a particular calendar month, including those listed by professional property managers and private landlords.
Residential dwellings include: Houses, apartments, units, retirement living, lifestyle properties, townhouses, home & income, multiple properties, and studios.
Tracking new listings helps us understand how many rental dwellings are coming onto the market and whether renters may have more or fewer options compared to previous months or years.
Rental stock#
Rental stock is the total number of residential dwellings advertised for rent on realestate.co.nz on the second-to-last day of each month.
While new rental listings count residential dwellings newly advertised for rent during the month, rental stock provides a snapshot of the total number of residential dwellings available for rent on the market.
Month-on-month (MoM)#
Month-on-month compares a figure to the previous month and can help identify recent changes in rental prices, listing activity, and rental stock.
For example, if the average weekly rental price was $600 in August and increased to $612 in September, that would represent a 2% month-on-month increase.
However, monthly figures can be influenced by seasonal trends, so it's useful to consider them alongside longer-term comparisons.
Year-on-year (YoY)#
Year-on-year compares data from a particular month with the same month in the previous year.
For example, comparing September 2026 with September 2025 would show how rental market conditions have changed over a 12-month period.
Year-on-year comparisons are particularly useful because they help account for seasonal patterns, such as periods when more rental properties typically come onto the market.
National vs regional rental data#
National rental data provides an overview of what's happening across New Zealand as a whole, while regional data looks more closely at local areas.
Although national figures can indicate broader rental market trends, conditions can vary significantly between regions.
For example, average weekly rental prices may be increasing in Canterbury while remaining relatively unchanged in Auckland.
Looking at both national and regional data provides a more complete understanding of the rental market, particularly for renters and landlords interested in a specific location.
Rental supply and demand#
Rental supply refers to the number of properties available for rent, while rental demand describes the level of interest from people looking for a rental property.
The balance between supply and demand can influence rental prices and how competitive the market is.
When rental supply is high relative to demand, tenants may have more choice, and landlords may face greater competition to attract tenants.
When demand is high relative to supply, fewer available properties can mean more competition among renters, potentially putting upward pressure on rental prices.
However, rental prices are also influenced by factors such as location, property type, size and condition.
Seasonal trends#
Seasonal trends are patterns in rental market activity that tend to occur at certain times of the year. They can help explain why rental listings or prices change from one month to the next.
For example, rental listing activity may increase during summer as people relocate for work, study or lifestyle changes.
For more insights into rental prices, listings and trends across the country, explore the latest New Zealand Rental Report.
Ready to find your next rental home? #
Set up your rental property search now, then filter by what matters to you and save your search to get new matching rentals delivered straight to you.
Want more property insights?#
- Market Insights: Search by suburb to see median sale prices, popular property types and trends over time.
- Switch your search to Sold to browse all residential properties that have sold - not just recent sales. See the most recent sale price and estimated current market value.